In engineering, to perform correctly fatigue tests is only half the job. The other - crucial - half is knowing how to interpret the results. Understanding how a material behaves under cyclic loading, how long it can withstand cyclic loading without failure and what patterns a fatigue failure leaves behind is essential for the safe and effective design of industrial components.
In this article we will go into post-test analysis: we will talk about S-N curves, service life, typical failures and parameters that condition fatigue resistance. If you are not yet familiar with the basics of the test, you can consult this introductory article on fatigue tests.
What is measured in fatigue tests?
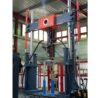
Fatigue tests make it possible to simulate the real conditions that materials and components undergo during their service life, especially when subjected to repeated or cyclic stresses.
Unlike static tests (such as tensile or compression), fatigue is caused by the accumulation of damage over time, even at stresses below the elastic limit of the material.
Among the main parameters recorded in these tests are:
- Number of cycles to failure (N): number of times the material withstands a cyclic load before breaking.
- Applied stress or load (S): is usually a percentage of the yield strength.
- Cycle frequency: can vary from 1 Hz to hundreds of Hz in accelerated tests.
- Type of load: axial, rotational, torsional or combined bending.
- Environmental conditions: temperature, humidity or presence of corrosive agents may alter the results.
All this information is translated into a key graph in fatigue analysis: the S-N curve.
S-N Curves: Interpretation and Practical Applications
What is an S-N curve and how is it generated?
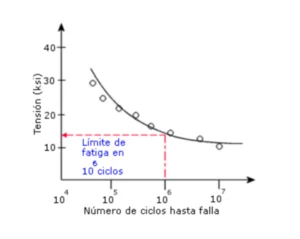
An S-N curve (also called Wöhler curve) graphically represents the relationship between the stress level (S) and the number of cycles to failure (N). To construct it, multiple samples of the same material, subjected to different load levels, are tested until failure occurs. The result is a point cloud that defines a downward curve: the higher the applied stress, the lower the number of cycles it can withstand.
This type of curve is essential in durability-based design, since it allows estimating the service life of a component under a given loading regime.
How to read an S-N curve
Two key areas can be identified by reading the S-N curve:
- High load failure zone: in the left part of the curve, where the material fails quickly after a few cycles.
- Low load fatigue zone: to the right of the curve, where materials can withstand millions of cycles before breaking.
In some metallic materials, such as steels, there is a fatigue limit or infinite fatigue strength: a load level below which the material can withstand an indefinite number of cycles without failure. On the other hand, materials such as aluminum or plastics do not have this limit and will always fail after a sufficient number of cycles, even if the number of cycles is very high.
Variability in curves: why are they not always the same?
The S-N curve may vary even for the same material, due to various factors:
- Microstructure and heat treatments
- Surface quality (roughness, inclusions, cracks)
- Test conditions (frequency, temperature, environment)
- Type of applied load (unidirectional, biaxial, multiaxial)
Therefore, it is common to construct curves with confidence limits or to use statistical approximations. In advanced laboratories, such as those at Servosis, standardized methods are used, such as ASTM E466 o ISO 1099 to ensure the reproducibility and validity of the results.
Fatigue failure analysis: signs and material behavior
Fatigue failure does not occur randomly or suddenly. It leaves a visible trace on the surface of the component which, when properly interpreted, reveals the source of the problem.
Identification of fatigue fracture:
A typical fatigue fracture has several distinct zones:
- Initiation zone: usually starts at a stress concentration, such as a corner, a hole or a surface imperfection.
- Propagation zone: striations or cyclic breakthrough marks are observed. This area can be studied by light or electron microscopy.
- Final failure zone: a sudden and catastrophic rupture when the remaining section cannot support the load.
These characteristics make it possible to differentiate fatigue failure from other types of failure (static overload, impact or corrosion).
Complementary methods of analysis
For a complete analysis, we often resort to tools such as:
- Scanning electron microscopy (SEM): allows the detail of the striae or micro-cracks to be seen.
- Fractographic techniques: help to identify the starting point of the failure.
- Data acquisition and analysis software: facilitates cyclic deformation monitoring and failure prediction.
At Servosis, our systems allow data to be captured and analyzed in real time, facilitating accurate and reliable interpretation of each assay.
Determine the service life of a component with actual data
One of the main objectives of the fatigue tests is to estimate the service life of a component under real working conditions. This prediction allows safe design, reduces costs due to oversizing and avoids premature failures.
Fatigue-based design approach
There are two main approaches:
- Design for finite life: it is accepted that the component will fail after a certain number of cycles, but it is designed so that this will occur after its expected life.
- Design for infinite life: working below the fatigue limit (material permitting) to ensure indefinite service life.
In both cases, safety factors are applied and variables such as environment, material variability and actual expected load are taken into account.
Application in critical sectors
Correctly interpreting a fatigue test can make the difference between a safe design and catastrophic failure. Some examples:
- Automotive: suspension parts, axles or engine components that undergo millions of cycles in their service life are evaluated.
- Aeronautics: wing structures, landing gear or joints that cannot afford the slightest failure.
- Medicine: orthopedic implants that must withstand years of cyclic loading within the human body.
- Railroad: wheels, axles, bogies or rails subjected to continuous repetitive stresses, where a failure can compromise the safety of the entire system.
A misinterpretation can have serious consequences: from unplanned shutdowns to structural accidents.
In fatigue testing, the raw data is not enough. The real useful information is in the analysis: how the material behaves, what failure patterns appear, and what implications it has for design or maintenance.
From Servosis, we help our customers not only to perform tests with maximum accuracy, but also to interpret the results in a technical, reliable and applied way to their needs. If you need an equipment or a customized solution for fatigue testing, we are here to help you.